
In response, we developed short-, medium-, and long-term climate change governance strategies. In terms of greenhouse gas emission control, we are committed to moderate reduction through the circular economy model and carbon reduction initiatives.
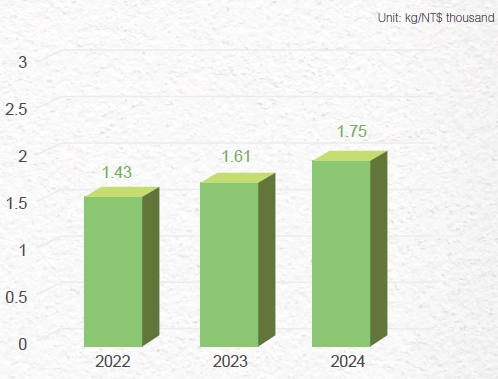
In 2024, our greenhouse gas emission intensity increased to 1.75 kgCO2/NT$ thousand, compared to 1.61 kgCO2/NT$ thousand in 2023.
2022~2024 Greenhouse Gas Emission Intensity Chart
Each Category of GHG Emission Chart in 4 Main Plants of Fwusow in 2024
Unit: tCO2e
 Read More
| Source of Emissions | Description | GHG Emissions | |
| 1.Direct GHG Emissions | Greenhouse gases owned or controlled by the company |
7,892.1675 | |
| Indirect Greenhouse Gas Emissions |
2.Imported Energy | Imported electricity | 12,609.1602 |
| 3.Transportation | - | - | |
| 4. Products used by an organization |
|
4,611.0538 | |
| 5. Associated with the use of products from the organization |
- | - | |
| 6.Other sources | - | - | |
| Direct & Indirect GHG Emissions | 25,112.382 | ||